Every race. Every track. Seconds after the finish.
Tonight's Greyhound Results — Live UK Dog Racing Scores & Track Data
Best Greyhound Betting Sites – Bet on Greyhounds in 2026
Tonight's Greyhound Results — Live UK Dog Racing Scores & Track Data
Tonight's greyhound results tell the story of every race run across the UK's licensed stadiums, from the first trap opening just after half six to the final finish well past ten. Whether you back a dog on instinct or spend twenty minutes cross-referencing form, the result you are waiting for will appear here — winner, finishing time, starting price, forecast and tricast dividends — seconds after the hare stops moving.
The UK is one of the few countries where greyhound racing operates on a genuinely industrial scale. Eighteen stadiums hold licences from the Greyhound Board of Great Britain, and between them they stage racing every single day of the week, morning through evening. The engine behind that volume is the BAGS system — originally the Bookmakers' Afternoon Greyhound Service — which, combined with SIS broadcasting contracts, ensures a constant supply of live action for betting shops and online operators alike. On any given evening, two or three meetings run simultaneously, each featuring twelve races at roughly fifteen-minute intervals. That is a lot of greyhounds crossing finish lines in a short space of time.
This page covers every race, every track. It is designed for people who want tonight's results quickly and cleanly, but also for anyone trying to understand what those results actually mean. Below, you will find live and fast result feeds, a breakdown of what each column in a results table tells you, a guide to the eighteen tracks still racing, and — because no honest discussion of greyhound racing in 2026 can avoid it — a data-driven look at the sport's welfare record. The numbers are here. What you make of them is up to you.
Every Race Distilled — What You Need Before the Traps Open
- Eighteen GBGB-licensed stadiums stage over 500 races per week across morning, afternoon, and evening meetings — SIS broadcasts at least 42 fixtures weekly, each with 12 races.
- Results include finishing positions, SPs, BSPs, forecast and tricast dividends, and race comments. Full results typically appear within five to ten minutes of the finish; live winner data arrives in seconds.
- Trap 1 wins roughly 18–19% of races nationwide — above the theoretical 16.6% — but track-specific variance is significant, so always check local trap bias data.
- The sport's welfare record is improving by rate (injury at a record-low 1.07%, retirement at 94%) but contested on absolute numbers (123 trackside deaths in 2024). Both the GBGB and animal welfare organisations cite the same dataset to support opposing conclusions.
- Betting turnover has dropped 23% in three years, squeezing BGRF funding to £6.75 million — well below historical peaks — and raising questions about long-term sustainability.
Live and Fast Results From Tonight's UK Meetings
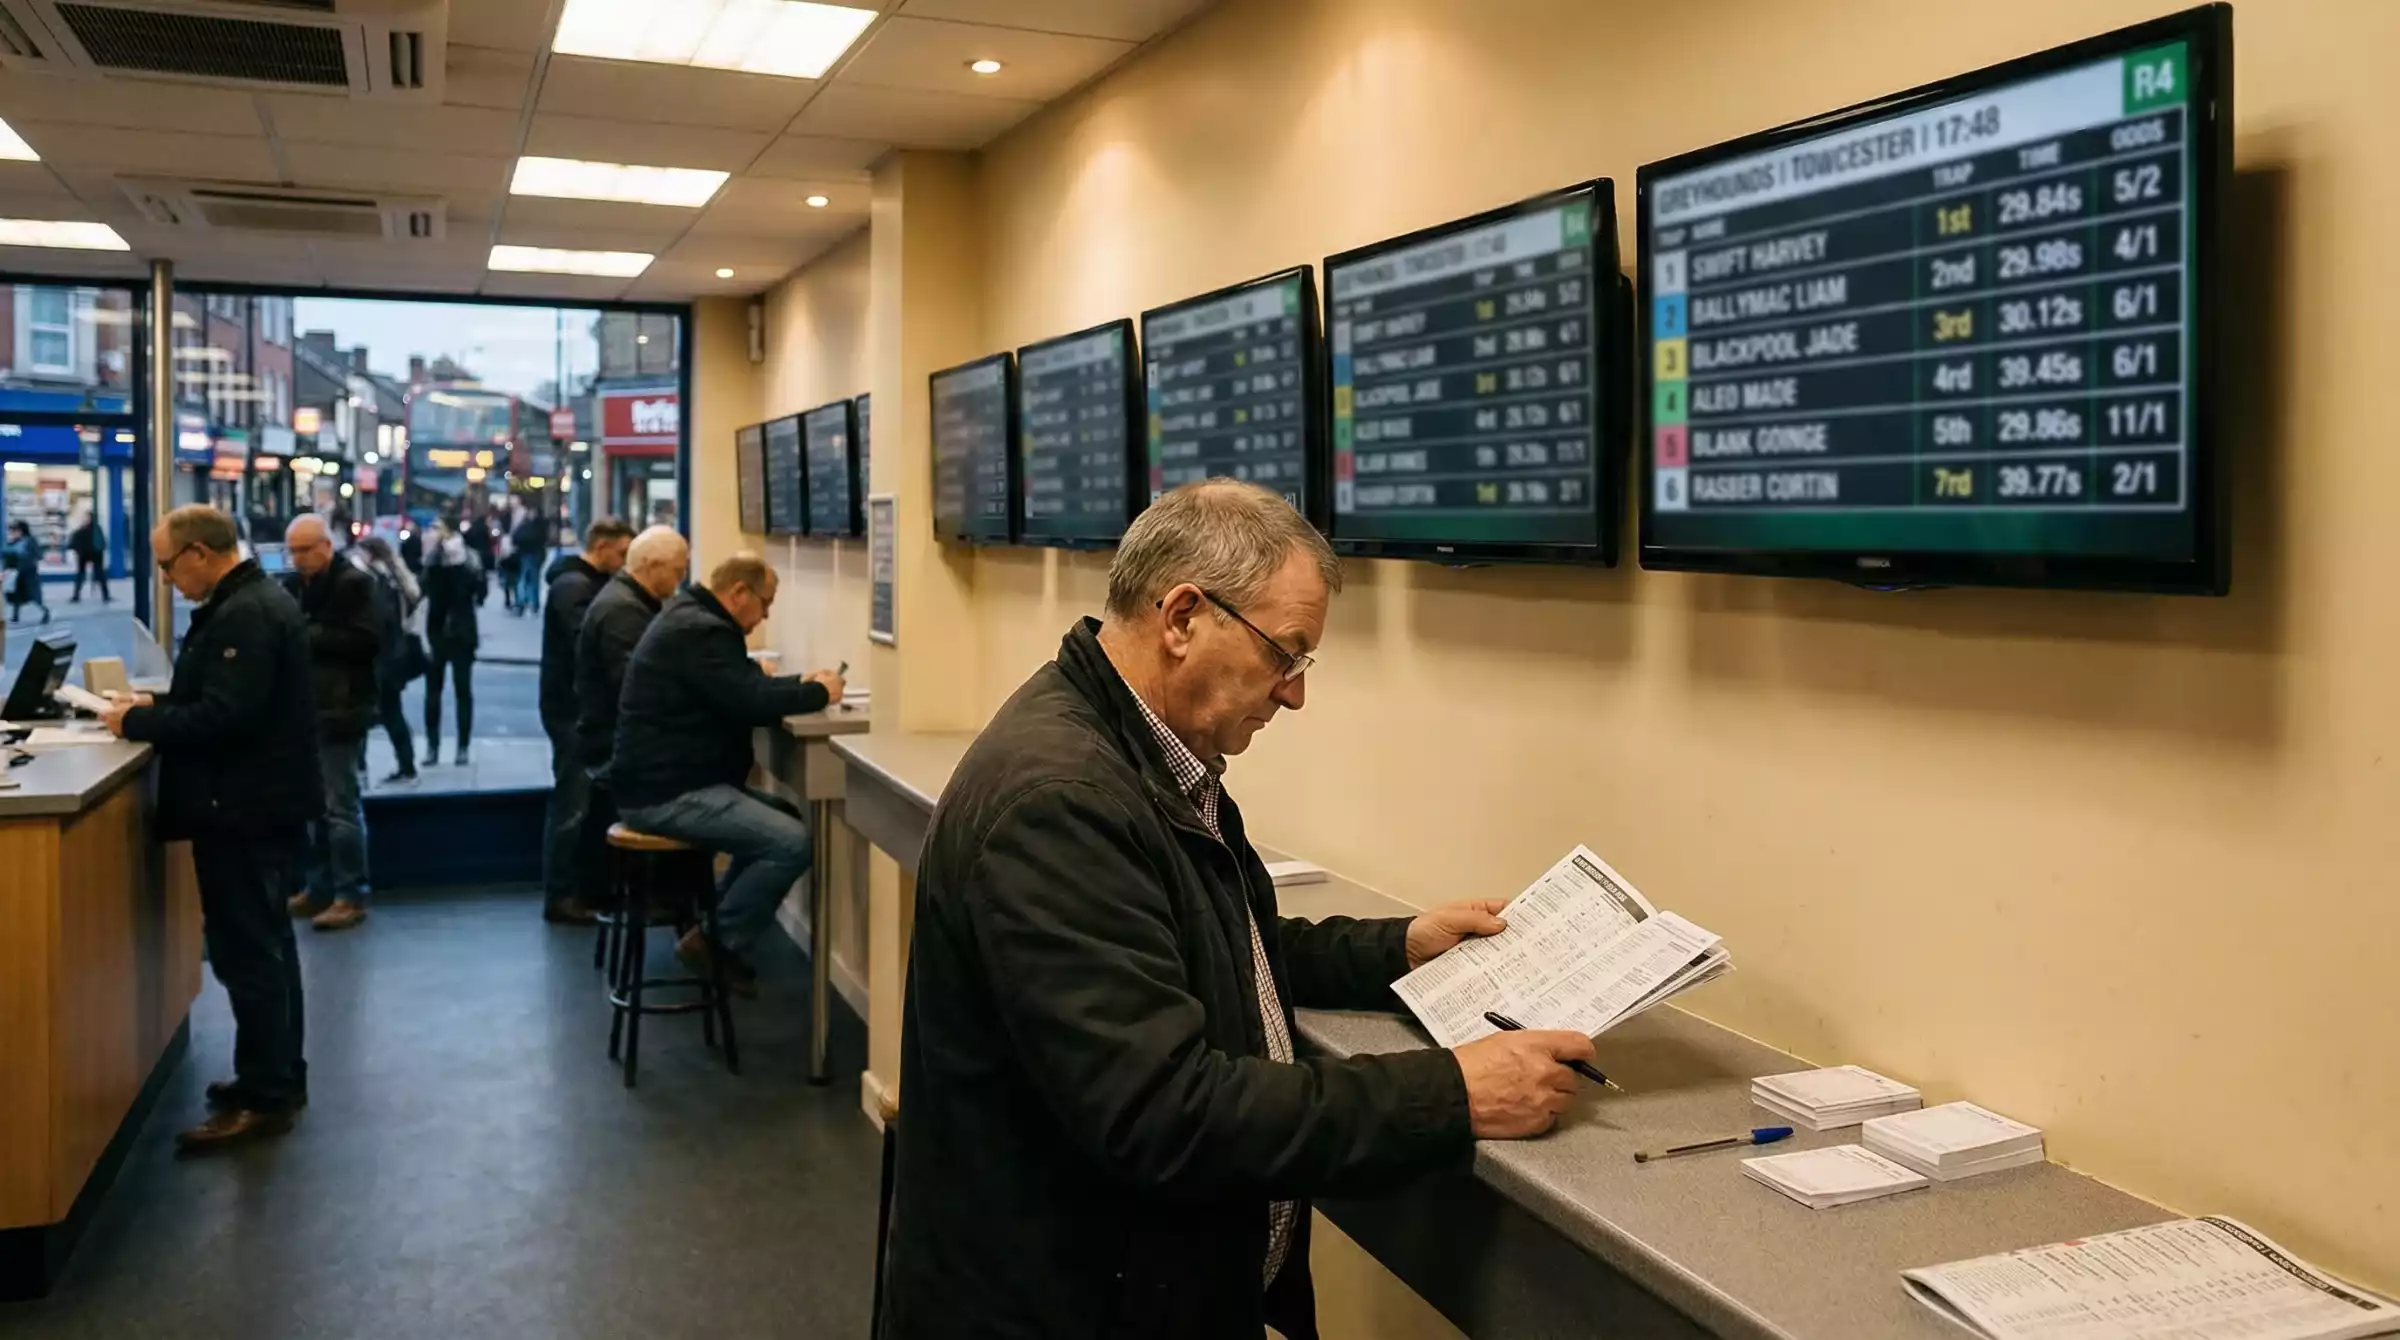
The moment a greyhound crosses the finish line at any GBGB-licensed stadium, a chain reaction begins. The photo-finish camera confirms the placings, the time is logged, and within seconds the data travels through the SIS broadcast network to screens in betting shops, streaming platforms, and results sites. If you are refreshing this page during a live meeting, you are plugged into that same pipeline.
Live results — the kind that appear within moments of the finish — typically show the winner, the finishing time, and the starting price. That is enough for most punters to know whether their bet has landed. Fast results add a layer: second and third place, forecast and tricast dividends, and sometimes the winning distance. Full results, which may take five to ten minutes, include every runner's finishing position, individual SPs, Betfair Starting Prices where available, race comments, and the official going report.
The volume of data is considerable. SIS delivers a minimum of 42 fixtures every week through its greyhound schedule, with each fixture comprising 12 individual races. That means well over 500 races per week, spread across morning, afternoon, and evening sessions. Not every track races every day — the schedule rotates to ensure consistent coverage for betting operators holding long-term contracts with SIS, including bet365, William Hill, Paddy Power, and Betfred.
For tonight's meetings specifically, you can expect two or three evening fixtures running in parallel. First races typically go off between 18:30 and 19:00, with the final race wrapping up around 22:00. Each race is separated by approximately fifteen minutes, which is enough time to check the result, assess the next racecard, and — if you are the methodical type — adjust your approach before the traps open again.
What live results include: winner, finishing time, SP. What fast results add: placed runners, forecast/tricast dividends, winning distance. What full results complete: every runner's position, BSP, race comments, going, sectional times where recorded.
The distinction between live, fast, and full matters if you are betting across multiple meetings. A punter tracking an accumulator across Romford and Sheffield simultaneously needs to know the winner in real time. Someone analysing form for tomorrow's card needs the full picture — comments like "baulked first bend" or "led rail throughout" tell a story that the finishing position alone cannot.
Filter Results by Track
Not every track races every evening. The schedule rotates, with each stadium assigned specific days by SIS and The Racing Partnership. On a typical weeknight, you might see Romford, Monmore, and Newcastle running evening cards, while Sheffield, Nottingham, and Hove take the following night. Knowing which tracks are live tonight saves you scrolling through results that have not happened yet.
The 18 active GBGB-licensed stadiums span the length of England and into Wales. Broadly, they cluster into regions: London and the South East (Romford, Hove, Crayford until its 2025 closure), the Midlands (Monmore, Nottingham, the new Dunstall Park), Yorkshire and the North (Sheffield, Newcastle, Sunderland), and a scattering of others including Kinsley, Henlow, and Central Park in Kent. Wales has a single licensed track, Valley Stadium, though its future is uncertain given the Senedd's vote to ban greyhound racing between 2027 and 2030. Scotland has none.
Evening cards dominate the schedule, but morning and afternoon meetings fill the daytime hours — those are primarily BAGS fixtures aimed at betting-shop and online audiences rather than trackside spectators. If you are filtering results and see a meeting timed at 10:30 or 14:00, it is almost certainly a BAGS card rather than a traditional evening meeting with a crowd behind the rails.
The practical advice is simple: check the fixture list before you start looking for results. If Romford races on Monday, Wednesday, and Friday evenings, there will be no Romford results to find on a Tuesday night. The fixture list, updated daily, tells you exactly where tonight's action is.
It is worth noting that some tracks carry a stronger reputation for certain types of racing. Nottingham's Colwick Park is known for its Boxing Day meeting, which in 2025 drew over a thousand spectators. Newcastle's Brough Park draws big crowds for the All England Cup. Romford's tight circuit rewards early pace and inside runners. These differences matter not just for the spectacle but for the results themselves — a dog with strong form at one track may not replicate it at another with a different layout and distance configuration.
Tonight's Greyhound Racing Schedule Across the UK
A typical evening in UK greyhound racing follows a pattern that has barely changed in decades, even as the economics and broadcasting behind it have transformed entirely. Two or three stadiums open their traps for evening meetings, each staging twelve races from first to last. The first race at most venues goes off between 18:30 and 19:00, with subsequent races spaced at intervals of roughly fifteen minutes. By 22:00, the last dogs have crossed the line, the results are in, and the stadium lights dim until the next scheduled meeting.
What has changed is who pays for all of this. The BAGS system underwrites the majority of UK greyhound fixtures. In its expanded format — widened in 2018 when The Racing Partnership joined the operation — BAGS now funds up to 74 meetings per week, with as many as 5,772 individual greyhound runs. That is a colossal amount of racing, far exceeding what trackside attendance alone could sustain.
SIS handles the broadcasting side, delivering those 12 races per fixture to betting operators worldwide. The schedule is built with bookmakers in mind: meetings are staggered so that bettors always have a race approaching, whether they are sitting in a William Hill shop in Birmingham or streaming through bet365 from their sofa. Evening meetings draw the largest television audiences, particularly on channels like RPGTV (Freeview channel 261) and Sky Sports Racing, which broadcast live from selected tracks.
The spring 2026 schedule follows the seasonal pattern. Longer daylight hours mean some tracks shift their first-race times slightly, but the core structure holds: twelve races, fifteen-minute gaps, two to three simultaneous meetings. If you are planning to follow tonight's card, the schedule below gives you the framework. The specific tracks racing tonight depend on the day of the week and the SIS rota, but you can always expect at least two evening venues to be live.
Typical evening meeting structure: 12 races, first race 18:30–19:00, ~15-minute intervals, final race around 21:45–22:00. Morning cards start from 10:30, afternoon cards from 14:00. All times are local UK time.
Full Results Breakdown — What Each Column Means
A greyhound results table packs a surprising amount of information into a small space. If you have never looked at one before, it can feel like reading a spreadsheet in another language. Each column, though, tells you something specific about what happened in that race — and once you know the code, you will never need to guess again.
Position and Dog Name
The finishing position is listed first: 1st through 6th (greyhound races in the UK almost always feature six runners). Next to it, the dog's name. Simple enough. But look carefully at the position column — if a dog is marked "DNF" (did not finish) or has a note about disqualification, the placings below it shift accordingly.
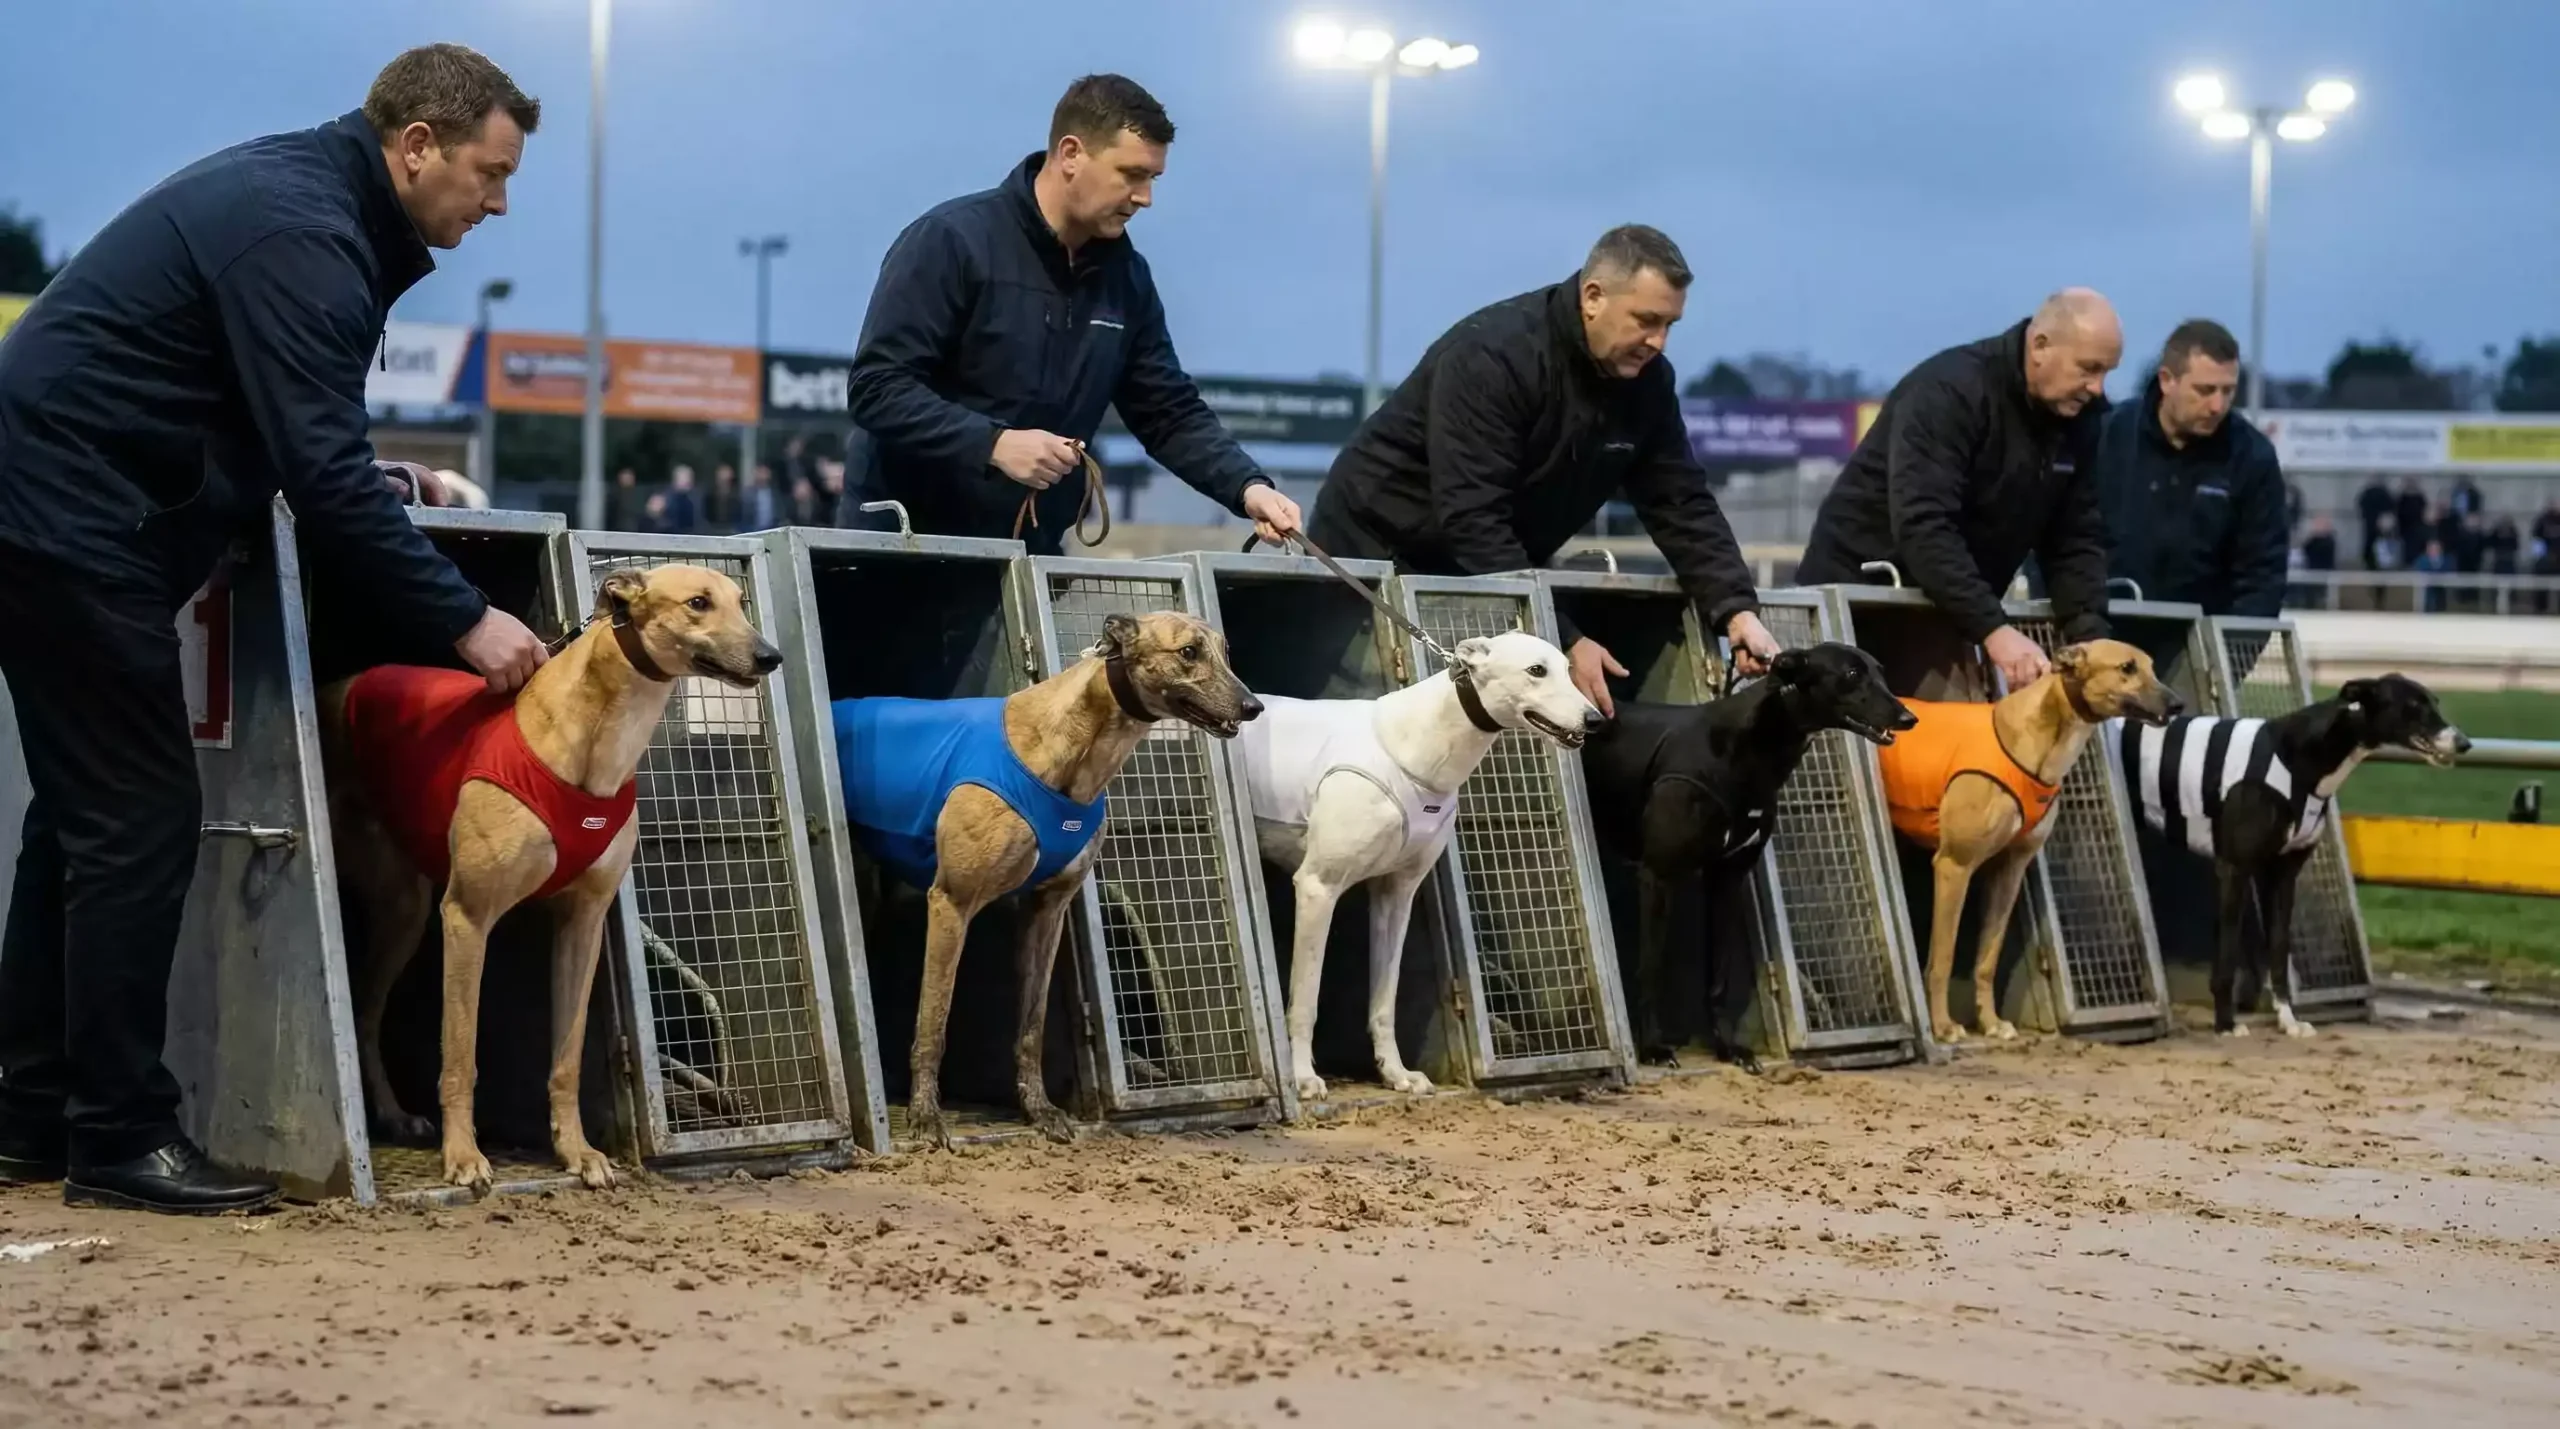
Trap Number and Colour
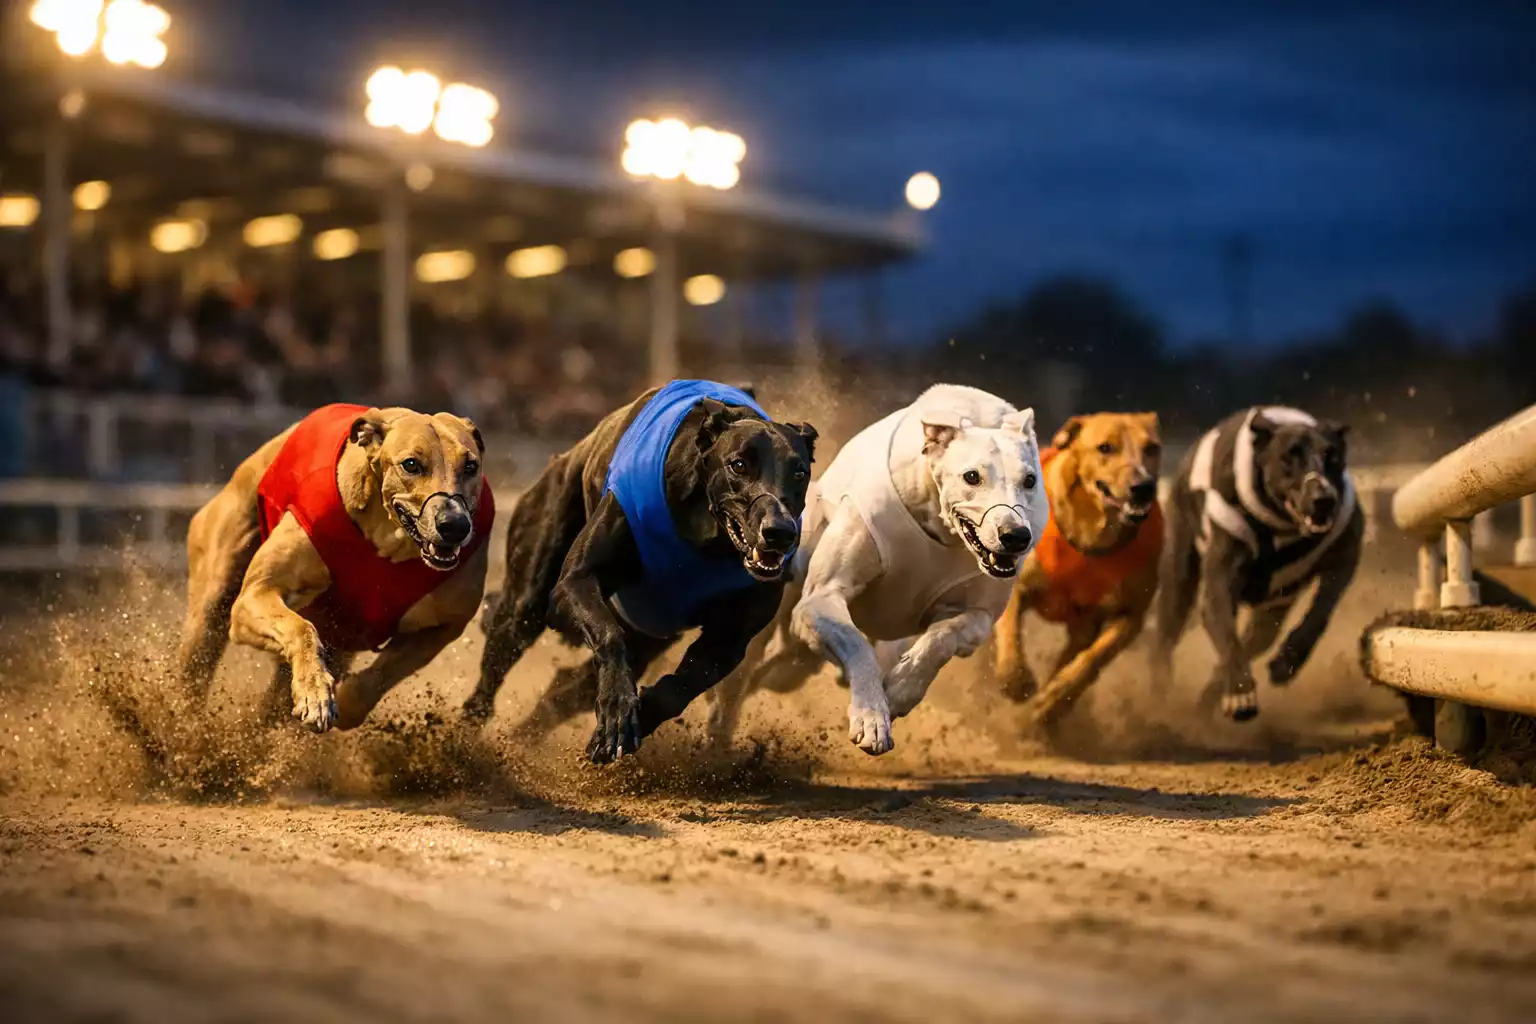
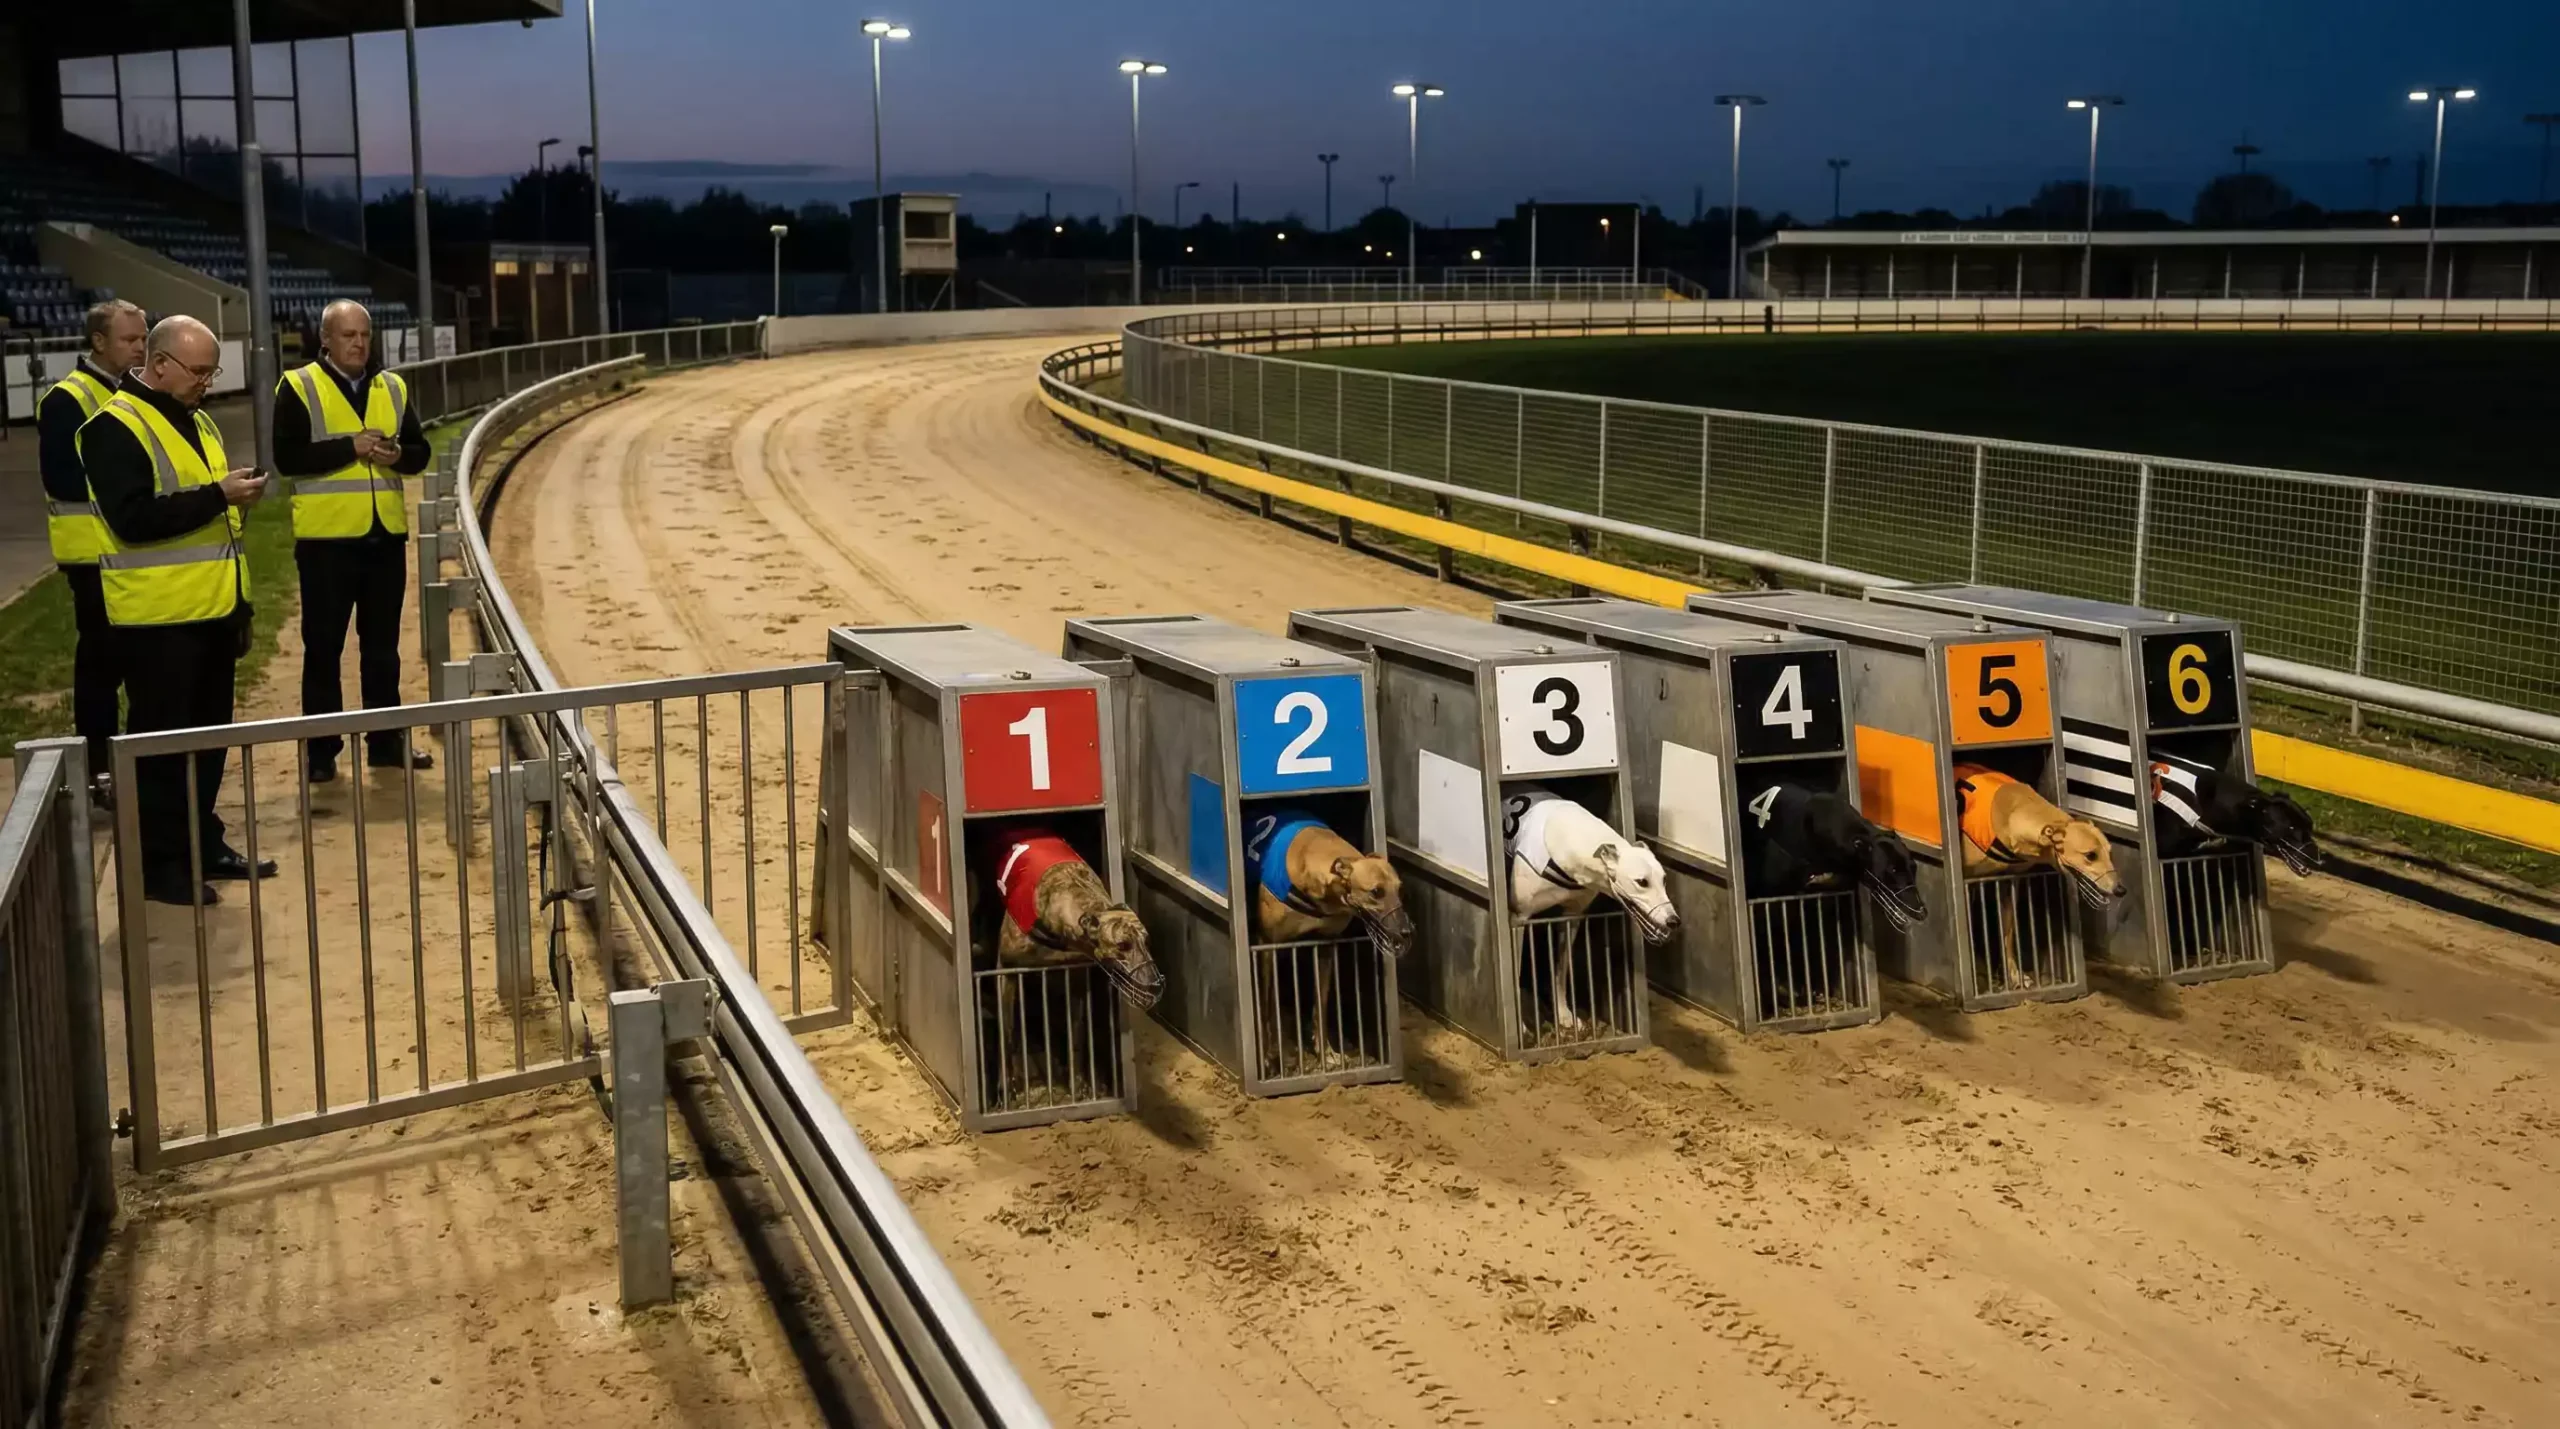
Every greyhound starts from a numbered trap, 1 through 6, and wears a colour-coded jacket to match: red for Trap 1, blue for Trap 2, white for Trap 3, black for Trap 4, orange for Trap 5, and black-and-white stripes for Trap 6. The trap number matters because it determines where on the track the dog starts, and — as we explore in the trap bias section below — some positions carry a measurable advantage at certain stadiums.
Finishing Time
Measured in seconds to two decimal places — for example, 29.43 over a standard 480-metre race. The time is determined by an electronic timing system triggered when the hare passes a sensor and stopped when the first dog crosses the line. Individual times for placed runners are sometimes listed, sometimes not, depending on the source. Comparing times across different tracks is unreliable because track lengths, surfaces, and bends vary.
Starting Price and Betfair Starting Price
The SP (Starting Price) is the official odds at which the dog started the race, determined by an SP reporter observing the on-course betting market at the moment the traps open. The BSP (Betfair Starting Price) is the exchange equivalent — the price at which the final matched bets on Betfair settled. The two numbers often differ. SP tends to reflect the weight of money from on-course bookmakers and betting-shop customers; BSP reflects exchange liquidity, which can be thin in lower-grade races.
Winning Distance
Expressed in lengths (one length equals roughly 0.08 seconds at full pace). A result might read "2¼ lengths" — meaning the winner crossed the line about two and a quarter body lengths ahead of the second-placed dog. Short heads and necks feature in close finishes.
Forecast and Tricast Dividends
The forecast dividend tells you what a winning straight forecast bet (first and second in exact order) paid. The tricast dividend covers the top three in exact order. These are typically displayed as returns to a £1 stake — so a forecast dividend of £18.40 means a £1 straight forecast on the correct first and second paid £18.40. Computer Straight Forecast (CSF) is calculated by a formula rather than drawn from a pool, which is why you sometimes see different forecast figures quoted by different sources.
Race Comments and Going
Full results often include brief running comments for each dog: "led 1st bend," "checked 3rd bend," "wide throughout," or "always prominent." These descriptions, written by track commentators, are invaluable for form analysis — they tell you not just where a dog finished but how it got there. The "going" (track condition) is also recorded: normal, slow, wet fast, or similar. Going affects finishing times and can suit certain running styles over others.
Mark Bird, Chief Executive of the GBGB, has pointed to the increasing transparency of race data as a sign of the sport's progress: "The initiatives we have introduced in recent years are now embedded and are helping to consolidate the significant progress we have made since 2018 across all measures." That progress includes more comprehensive injury reporting, but it also extends to the accessibility of results data — something that matters to anyone trying to make sense of tonight's card.
Transition from reading results to understanding the industry behind them.
UK Greyhound Racing in Numbers
Strip away the emotion and the politics, and greyhound racing in Britain is a surprisingly large operation. It employs around 500 licensed trainers, approximately 3,000 kennel staff, and some 700 racecourse officials across those 18 GBGB-licensed stadiums. Those are not trivial numbers for a sport that many people assume is fading into irrelevance.
The total prize fund across all licensed UK greyhound racing stands at £15,737,122. The headline figure sits at the top: the English Greyhound Derby winner takes home £175,000, making it the single richest prize in the sport. Below that, prize money drops sharply — graded BAGS races may offer a few hundred pounds to the winner — but the cumulative total reflects the sheer volume of racing that takes place week after week.
Globally, the greyhound racing market was valued at approximately .1 billion in 2024, with projections suggesting growth to .8 billion by 2033 at a compound annual growth rate of 4.2%. The UK represents a significant slice of that market, though the sport's footprint has been contracting domestically even as international interest — particularly from betting operators — remains steady.
In 1946, greyhound racing in Britain attracted an estimated 75 million spectators across its peak of 77 licensed tracks (reached in January 1947). London alone had 15 stadiums, with the largest pulling in 30,000 to 40,000 fans on a Saturday evening. Today, 18 tracks remain — but the sport generates more betting turnover per fixture than it did at its mid-century peak.
The modern industry looks nothing like its post-war ancestor. Trackside attendance, while growing modestly (Arena Racing Company reported a 5% increase across its greyhound venues in 2025), accounts for only a fraction of the sport's economic activity. The real revenue comes from betting — and specifically from the relationship between tracks, SIS broadcasting, and the bookmakers who pay for the content. That relationship, and the voluntary levy that funds it, is examined in detail further down this page.
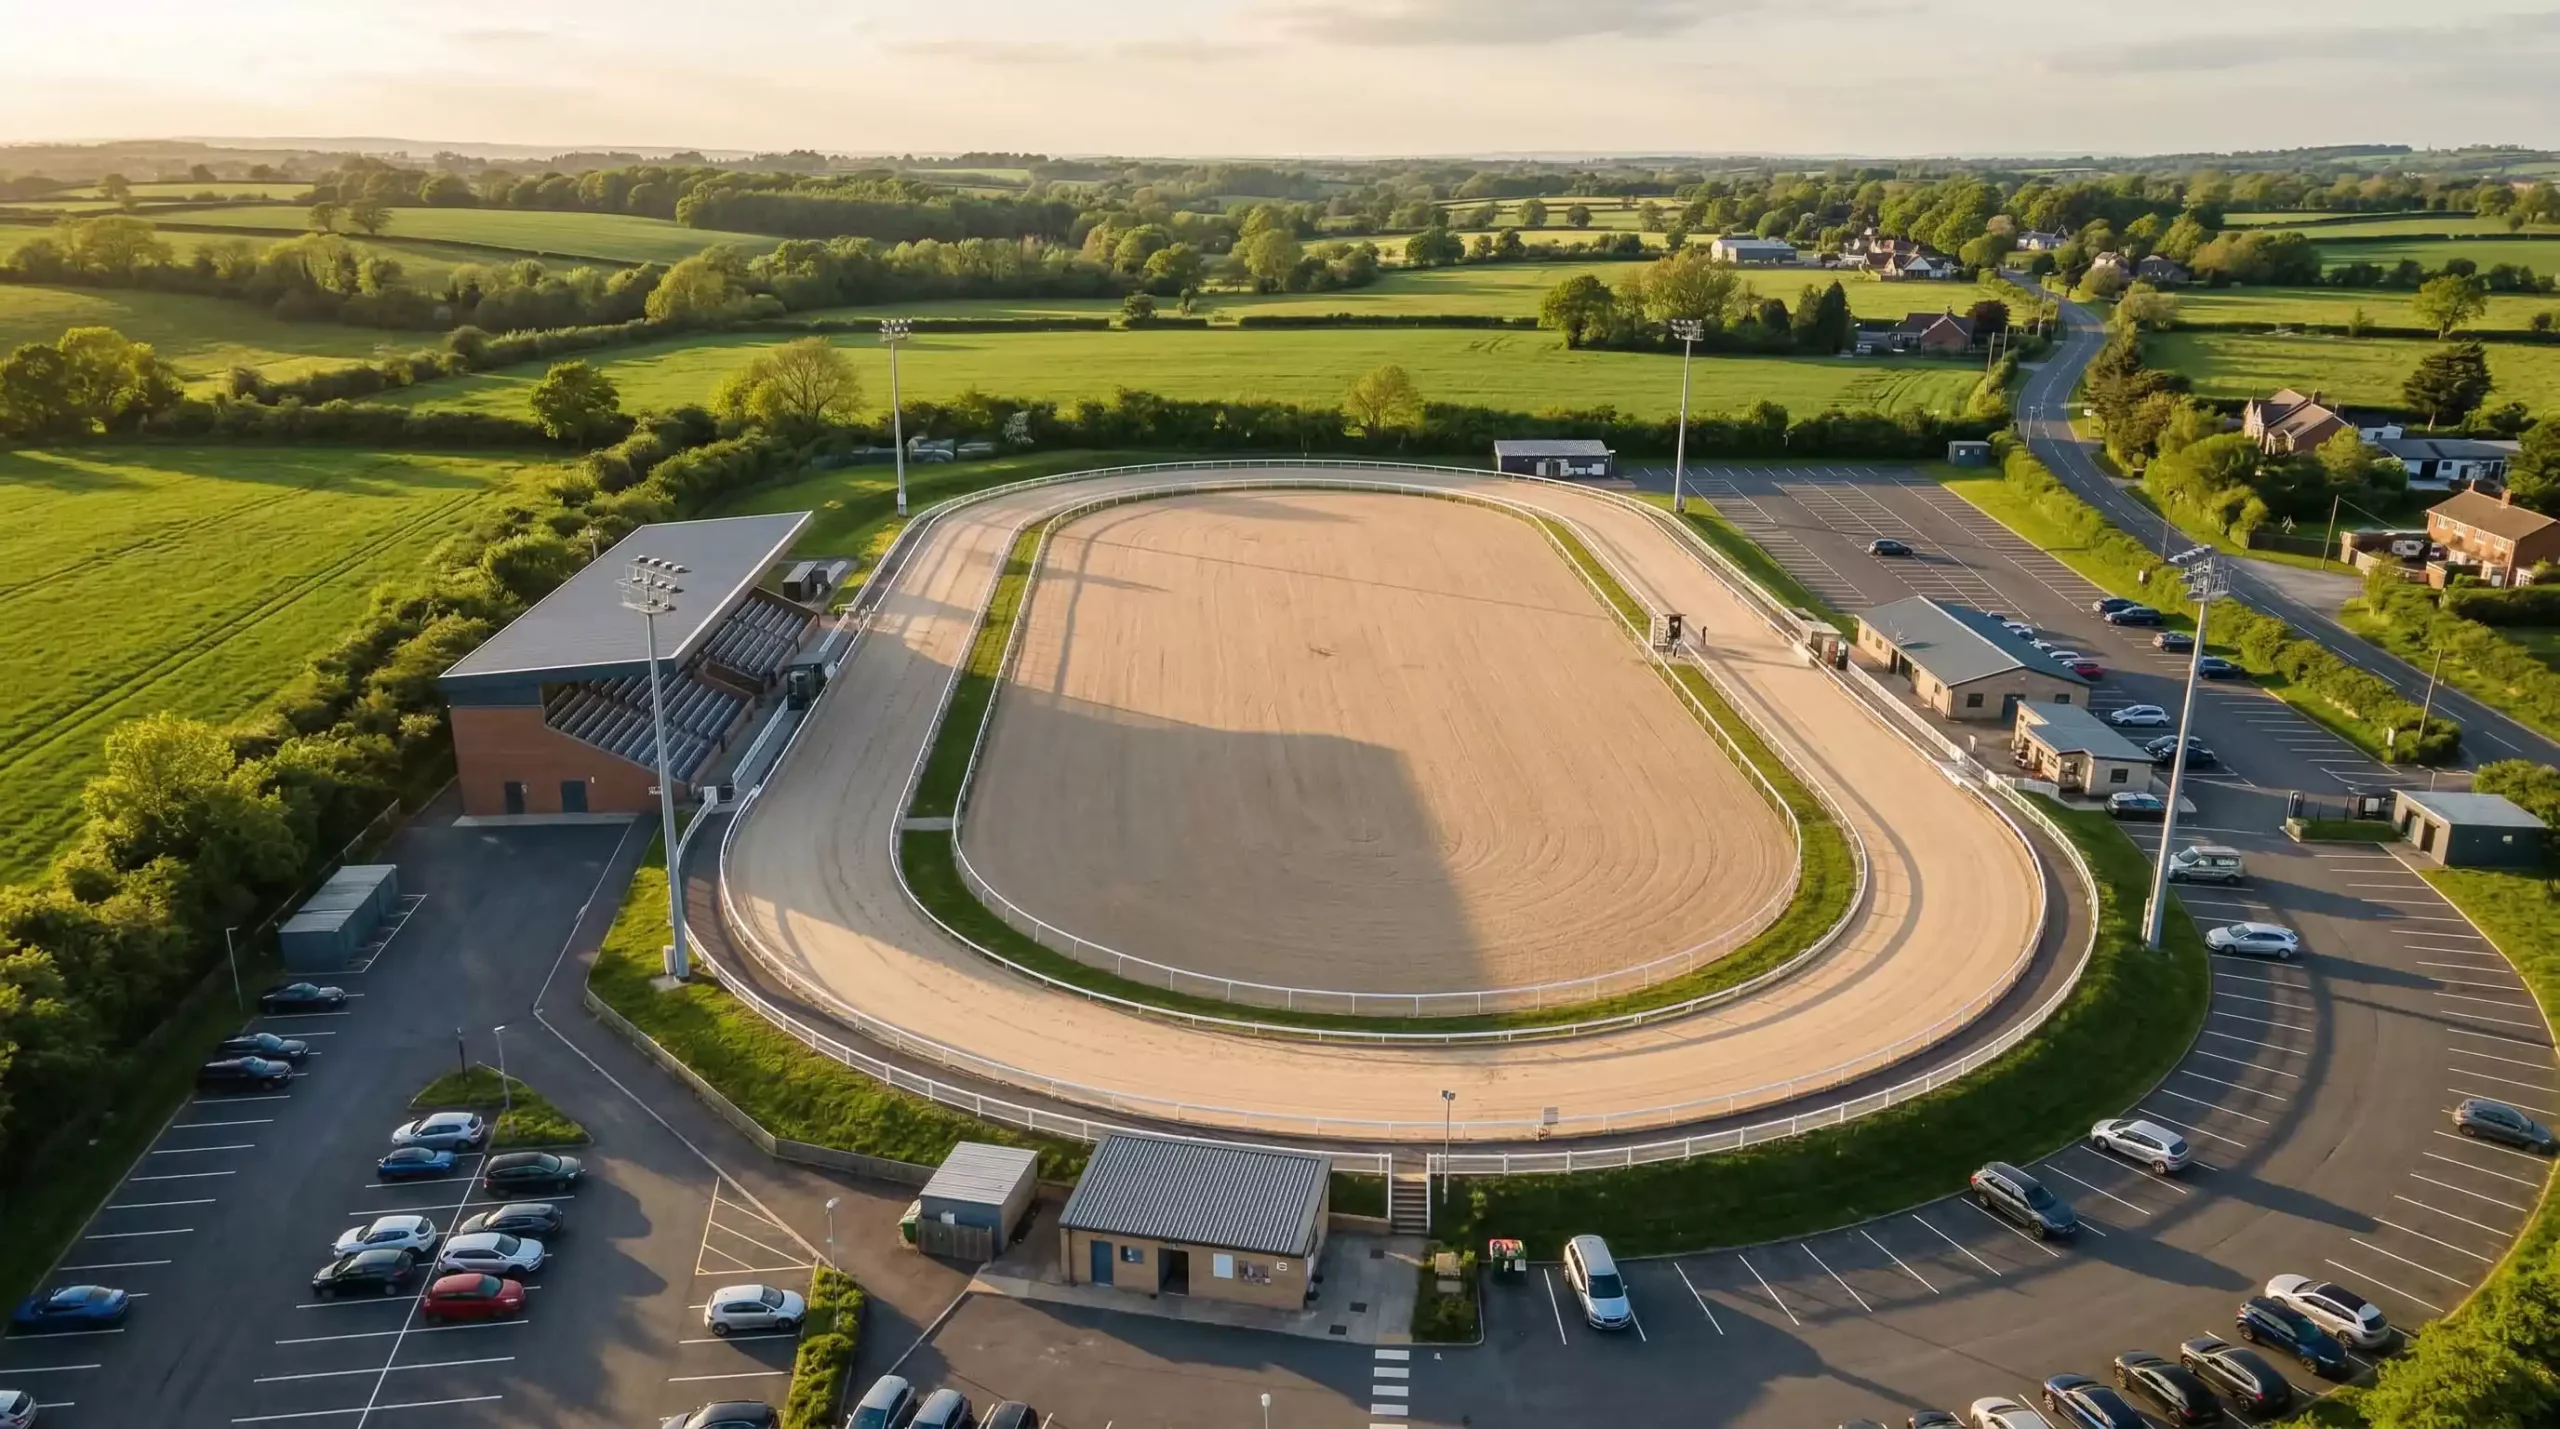
A Quick Guide to UK Greyhound Tracks
The geography of UK greyhound racing has contracted dramatically over the past eighty years. From 77 licensed tracks in January 1947, the sport now operates across just 18 GBGB-licensed stadiums. Scotland has no active tracks. Wales has one — Valley Stadium — but the Senedd's December 2025 vote (36–11) to ban the sport means its days are numbered, with the prohibition set to take effect between 2027 and 2030. Every other licensed track sits in England.
London and the South East
Romford is the capital's busiest greyhound stadium, running three evening meetings per week and hosting some of the most competitive open races outside the Derby. Hove, on the south coast near Brighton, offers a contrasting experience — a wider track with different trap dynamics. Crayford, once a Kent staple, closed in 2025 after decades of operation, leaving a gap in south-east racing.
The Midlands
The Midlands has seen the most dramatic reshaping. Perry Barr, Birmingham's historic home of the English Greyhound Derby, closed in 2025 — but the sport gained Dunstall Park in Wolverhampton, the first purpose-built greyhound stadium in the UK for over a decade. The Oaks final at Dunstall Park in 2025 drew 324% more spectators than the same event at Perry Barr the year before. Monmore Green, also in Wolverhampton, and Nottingham's Colwick Park round out the region's active tracks.
The North
Newcastle's Brough Park has been one of the sport's success stories, with attendance at its All England Cup finals rising by 85% according to Arena Racing Company data. Sheffield's Owlerton Stadium — one of the oldest active tracks — caters to a devoted Yorkshire audience, while Sunderland provides a second north-east option. Kinsley, in West Yorkshire, is a smaller operation but contributes to the BAGS schedule.
The Broader Picture
Tracks like Henlow (Bedfordshire), Yarmouth (Norfolk), and Central Park (Kent) fill out the map, each with its own character, distances, and racing nights. The centenary year of 2025 was bittersweet: three stadiums closed (Crayford, Perry Barr, Swindon), but Dunstall Park's opening and the ARC footfall growth suggest the remaining tracks are finding their footing. The question now is whether 18 stadiums is a sustainable number — or a staging post on the way to fewer.
Trap Bias — Does Starting Position Affect Results?
In a six-runner race, each trap should theoretically produce a winner 16.6% of the time. In practice, it does not work that way. Aggregated data from UK tracks shows that Trap 1 — the red jacket, closest to the inside rail — wins approximately 18 to 19% of all races. That two-to-three percentage point edge over the theoretical average might sound modest, but over hundreds of races it represents a statistically significant and exploitable pattern.
The explanation is mechanical rather than mystical. The dog in Trap 1 has a "protected flank" — it only needs to defend its running line from one side. On tight tracks with sharp first bends, the inside draw offers an even greater advantage because the dog reaches the rail first and dictates the pace through the turn. On wider, more galloping tracks, the advantage shrinks.
Track-specific variance can be dramatic. Historical data from Wimbledon showed that 43.69% of winning favourites came from Trap 6 (the widest draw), while at Harlow the figure was even higher at 47.12%. At Kinsley, by contrast, Trap 6 accounted for just 21.84%. These differences reflect each track's geometry: the length of the run to the first bend, the sharpness of the turns, and the camber of the surface all play a role.
For tonight's results, trap data adds a layer of analysis that pure form figures miss. A dog with three recent wins from Trap 1 at Romford may be far less effective when drawn in Trap 5 at Newcastle. The combination of trap draw, track geometry, and individual running style is what makes greyhound racing analytically interesting — and what makes a blanket "always back Trap 1" strategy more nuanced than it first appears.
Trap 1 has a measurable win-rate advantage across UK tracks, but the size of that advantage — and whether it even holds — depends entirely on the specific stadium. Always check track-level trap statistics before weighting your analysis.
Betting on Tonight's Greyhounds — What the Numbers Show
Greyhound racing is the UK's second-largest betting sport by turnover, trailing only horse racing. But the trajectory is not encouraging. Adjusted for inflation, betting turnover on greyhound racing fell by 23% over the three years to March 2024, according to data published by the Gambling Commission. That decline matters because the sport's funding model — a voluntary levy paid by bookmakers — is pegged directly to turnover.
The British Greyhound Racing Fund (BGRF) collected £6.75 million from bookmaker contributions in the 2024–25 financial year. That figure is drawn from a 0.6% levy on greyhound betting turnover, paid voluntarily by participating operators. More than three quarters of that income goes directly to welfare and integrity programmes. The problem is that the levy percentage has not changed since 2009, and the total pot has shrunk significantly from historical peaks of £10–14 million in real terms.
Mark Bird, Chief Executive of the GBGB, has been blunt about the implications: "Since the GBGB began operating in 2009, there's been no increase in the percentage that's being paid, which is 0.6% of greyhound turnover. What that has meant is that the amount year-by-year has steadily gone down. We are going to get to a stage where we're going to struggle to meet our welfare ambitions, unless that levy changes." The industry's argument for a statutory levy — mandatory rather than voluntary, as exists for horse racing — has gained traction but not yet political support.
For the bettor sitting down to tonight's card, these macro numbers matter less than the immediate question: where is the value? The 23% turnover decline does affect liquidity, particularly on Betfair, where BSP in lower-grade BAGS races can be volatile due to thin matching pools. On-course SP remains the benchmark for most punters, though anyone betting in size on exchange markets should be aware that the pool depth is not what it was five years ago.
The broader market context is not lost on regulators either. The Gambling Commission's annual statistics show overall UK gross gambling yield reached £16.8 billion in the year to March 2025, up 7.3% year on year. Greyhound betting is a small fraction of that total — dwarfed by football, horse racing, and online casino — but the sport's reliance on the betting ecosystem makes it especially sensitive to shifts in regulatory policy and operator appetite. When bookmakers decide to reduce greyhound coverage or renegotiate SIS contracts, the tracks feel it within months.
Welfare in UK Greyhound Racing — The Data Behind the Headlines
No article about greyhound results in 2026 can pretend that welfare is a footnote. It is the issue that dominates political discourse about the sport, drives legislation in Wales and Scotland, and — depending on which numbers you read — either demonstrates meaningful progress or exposes persistent harm. Both readings draw on the same dataset. The difference lies in interpretation.
Injury Rates
In 2024, the GBGB recorded 3,809 injuries from 355,682 runs on licensed tracks — an injury rate of 1.07%, the lowest since the board began publishing data. That figure has fallen steadily since 2018, when the GBGB committed to full transparency following a UK Parliament EFRA Committee report that criticised the industry's reluctance to disclose welfare statistics. The cumulative toll remains substantial: between 2017 and 2024, GBGB data shows 35,168 injuries in total, including 1,353 deaths on track and 3,278 dogs euthanised for other racing-related reasons.
Fatalities
The track fatality rate has halved, from 0.06% in 2020 to 0.03% in 2024. In percentage terms, that is a genuine reduction. In absolute numbers, the picture is more complicated. According to Dogs Today Magazine, 123 greyhounds died on GBGB-licensed tracks in 2024 — the highest absolute figure since 2020 — and a total of 346 dogs lost their lives from racing-related causes that year. The percentage falls because the denominator (total runs) has grown, but the raw count of dogs dying has not fallen at the same pace.
This is where the debate sharpens. The GBGB emphasises the declining rate. Opponents emphasise the persistent count. Both are factually correct. Which metric matters more is a question the data alone cannot answer.
Retirement
The retirement figures are the industry's strongest statistical argument. In 2024, 94% of greyhounds leaving racing were successfully rehomed or retained — 5,795 dogs in total, up from 88% in 2018. Of those, 27.1% were kept by their owners or trainers, 55.8% were placed through charities (the Greyhound Trust being the largest), and 11% went through other routes. The starkest improvement: just 3 greyhounds were euthanised for economic reasons in 2024, compared with 175 in 2018 — a 98% reduction that reflects both policy changes and genuine cultural shifts within the industry. The GBGB's Injury Recovery Scheme (IRS), which funds veterinary treatment for career-ending injuries, has paid out nearly £1.5 million since its launch in December 2018.
The Opposing View
Dr Sam Gaines, Head of Companion Animals at the RSPCA and Chair of the Cut The Chase coalition, has argued that incremental improvements do not address the fundamental problem: "Even if these issues had been resolved, there is the undeniable truth that greyhounds racing around an oval track at high speed is inherently dangerous and puts them at risk of predictable, avoidable and unnecessary injury and death." That position — shared by a coalition of animal welfare organisations — underpins the legislative drives in Wales and Scotland and shapes how a significant portion of the British public views the sport.
The GBGB's counter-argument rests on trajectory. Injury rates are falling. Fatality rates are falling. Retirement outcomes have improved dramatically. The welfare strategy documents published by the board — "A Good Life for Every Greyhound" and its progress reports — set targets and report against them publicly. Whether that trajectory is fast enough, or whether any level of racing-related injury is acceptable, is the question that separates reformers from abolitionists.
Frequently Asked Questions About Greyhound Results
How do I read greyhound racing results?
A greyhound results table shows each runner's finishing position, trap number, finishing time, and starting price (SP). Full results also include the Betfair Starting Price (BSP), forecast and tricast dividends, the winning distance in lengths, and race comments describing how each dog ran. The finishing time is measured in seconds to two decimal places over the stated distance — for example, 29.43 seconds over 480 metres. The SP is the official odds at which the dog started, determined by an on-course reporter. Forecast dividends show the return on a £1 stake for correctly predicting the first and second in exact order; tricast dividends cover the top three. Race comments like "led 2nd bend" or "checked 1st turn" are shorthand descriptions written by track commentators and are valuable for form analysis — they tell you not just where the dog finished but why. The going (track condition) is listed separately and affects how finishing times should be interpreted.
What is a forecast and tricast in greyhound racing?
A forecast bet requires you to predict the first two finishers in a race in the correct order. A straight forecast names one dog for first and another for second; a reverse forecast covers both possible orders but costs twice the stake. A tricast extends the challenge to the top three finishers in exact order. Because getting the precise finishing order right is harder than simply picking a winner, forecast and tricast dividends are typically much larger than win-bet payouts. Dividends are calculated either via a Computer Straight Forecast formula (CSF) or from a totalisator pool, depending on the operator. In a six-runner greyhound race, the tricast has 120 possible permutations, which is why returns can be significant even when the placed dogs are not long-priced individually. The dividends displayed in tonight's results represent the return to a £1 unit stake.
Which UK greyhound tracks race tonight?
The specific tracks racing on any given evening depend on the SIS schedule, which rotates fixtures across the 18 GBGB-licensed stadiums. On a typical weeknight, two or three tracks will host evening meetings, each running 12 races from approximately 18:30 to 22:00. Common evening venues include Romford (Monday, Wednesday, Friday), Sheffield (Tuesday, Thursday, Saturday), Monmore, Newcastle, Hove, and Nottingham, though exact schedules shift seasonally and are confirmed by SIS and The Racing Partnership each week. The best way to confirm tonight's specific fixtures is to check the daily schedule on a results platform or the SIS fixture list. Morning and afternoon cards — primarily BAGS fixtures for the betting market — run alongside the evening programme, meaning there can be racing at multiple tracks throughout the day even if only two or three host evening meetings.
Results Archive — Looking Up Past Races
Tonight's results become yesterday's archive the moment the last meeting finishes. But that archive is far more than a historical curiosity — it is the raw material for form analysis, the basis for identifying track-specific patterns, and, over longer time frames, a record of how the sport itself has evolved.
Most results platforms store data by date, track, and race number. You can look up a specific meeting from last Tuesday at Romford, or trace a particular dog's racing career across months of results. Full archive entries typically include everything found in live results — positions, times, SPs, dividends, comments, and going — which makes them suitable for serious form study. Some premium services, notably Timeform, add their own ratings and sectional analysis on top of the raw data.
The depth of available archives varies. GBGB records extend back several years for licensed tracks, while independent databases and media archives may cover even longer periods. For a sport that drew an estimated 75 million spectators in 1946 across what would peak at 77 licensed venues, the archived results from earlier decades represent a chronicle of British social history as much as sporting data. Accessing those older records typically requires specialised databases or library research, but anything from the past decade is readily available online.
One practical use of the archive: tracking how a dog performs on a specific track over multiple visits. If a greyhound has run at Sheffield six times and finished in the top two on four occasions, that pattern is far more telling than a single result. Similarly, comparing a dog's times over the same distance at the same venue — controlling for going — can reveal whether it is improving, declining, or performing consistently. The archive is where form analysis begins in earnest.